How Player Data Analytics Shape Bet Sizing Patterns in Multi-Table Online Split-Pot Events
Quinn Krüger · Jul 17, 2026
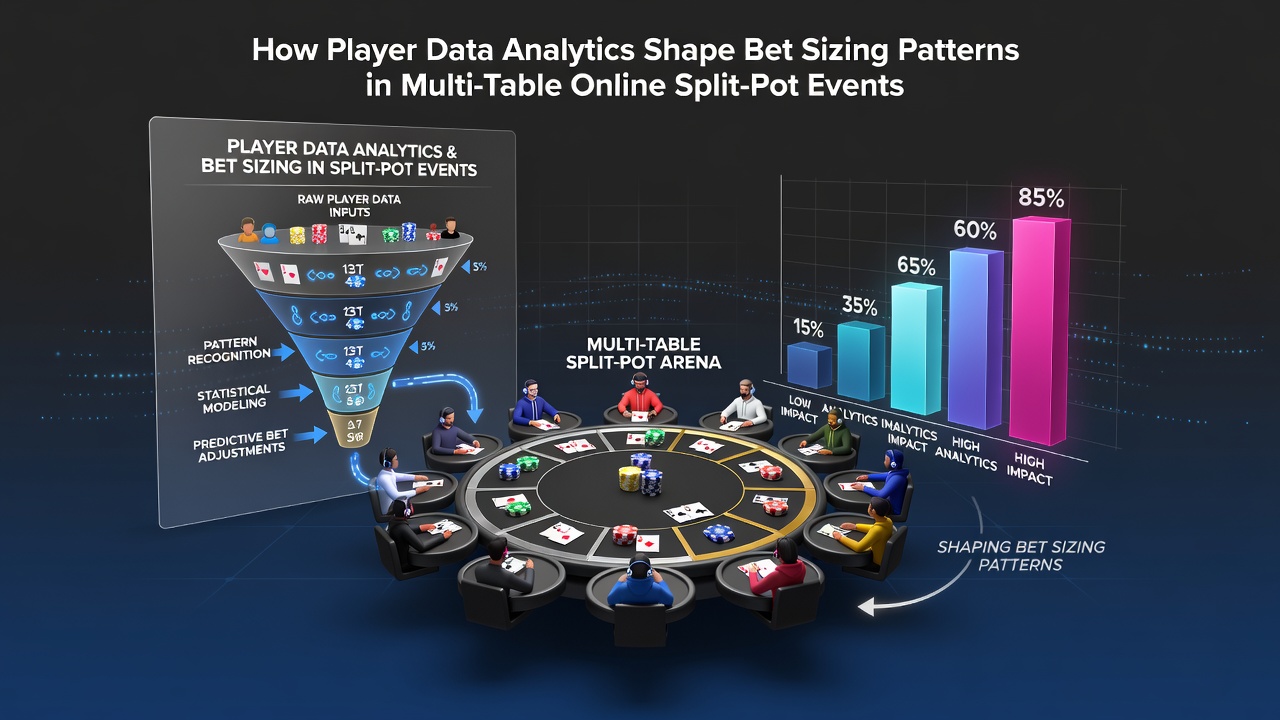
How Player Data Analytics Shape Bet Sizing Patterns in Multi-Table Online Split-Pot Events
Data analytics platforms track every action in multi-table online split-pot events, where games like pot-limit Omaha generate wide ranges and frequent multi-way pots that demand precise bet sizing adjustments. These systems collect hand histories from thousands of participants across simultaneous tables, then break down frequencies for continuation bets, overbets, and check-raises according to stack depth and position. Operators running July 2026 series report that players who review aggregated datasets adjust their sizing patterns more consistently than those relying on intuition alone.Data Collection in Split-Pot Environments
Online platforms log bet amounts relative to pot size in real time, capturing how participants respond when equity splits across multiple opponents. Researchers analyzing these logs note that average bet sizes in four-bet pots during Omaha events often settle between 55 and 70 percent of the pot, a range that reflects the need to deny equity without overcommitting against drawing hands. Software filters isolate these situations by board texture and player count, allowing pattern recognition across different tournament stages.
Multi-table formats add another layer because participants move between tables with varying blind levels and payout structures. Analytics tools correlate bet sizing decisions with remaining stack sizes and the number of active tables per player, revealing that larger stacks tend to use smaller relative bets early in events to maintain flexibility for later streets.
Bet Sizing Adjustments Based on Opponent Modeling
Players import hand histories into tracking programs that build profiles of frequent opponents, highlighting tendencies such as over-folding to large bets on monotone boards or calling wider in position. These models feed directly into sizing recommendations that shift according to the modeled fold frequency. Data from major operators shows that bet sizes increase by roughly 15 percent against players flagged for high fold-to-continuation-bet rates, while sizes decrease against calling stations identified through the same datasets.
Patterns in Multi-Way Pots
Split-pot games produce more multi-way action than heads-up formats, so analytics engines segment data by number of callers. When three or more players see a flop, optimal sizing patterns shift toward smaller bets that maintain range advantage while extracting value from weaker holdings. Observers note that participants reviewing these segmented reports reduce their average bet size in multi-way scenarios by 10 to 20 percent compared with their unadjusted baseline.

Platform Tools and Real-Time Feedback
Contemporary poker clients integrate lightweight analytics overlays that display suggested bet sizes derived from population data and personal history. These overlays update during hands, factoring in current pot odds and estimated opponent ranges pulled from stored databases. Participants in July 2026 online circuits use these tools to maintain consistent sizing even when switching between multiple tables with different dynamics.
Academic studies on gaming behavior, including work published through the American Gaming Association, examine how such feedback loops influence decision speed and accuracy in split-pot variants. Separate reports from the Nevada Gaming Control Board track aggregate trends in online poker participation and note rising adoption of analytical software among multi-table regulars.
Long-Term Pattern Evolution
Over repeated events, players refine their sizing libraries by reviewing session reports that compare actual bets against recommended ranges. Those who apply these comparisons systematically show narrower variance in outcomes across similar spots. Tournament series data indicates that regulars who maintain detailed personal databases adapt faster to format changes, such as new blind structures or payout adjustments introduced mid-series.
Conclusion
Player data analytics continue to refine bet sizing precision in multi-table online split-pot events by converting raw hand histories into actionable frequency profiles and opponent models. The patterns that emerge—smaller bets in multi-way pots, adjusted sizes against specific tendencies, and real-time feedback during play—reflect the measurable influence of these tools on competitive decision-making across current tournament schedules.