Economic Indicators Shaping Participation Cycles in Remote Card Competitions
Mia Simmons · May 26, 2026
Economic Indicators Shaping Participation Cycles in Remote Card Competitions
Remote card competitions have expanded rapidly over the past decade, and participation levels often track broader economic conditions according to multiple industry reports. Observers note that shifts in employment rates, consumer spending patterns, and disposable income figures frequently coincide with changes in entry volumes for online tournaments and cash games across digital platforms. Data from regulatory filings shows these cycles tend to repeat in patterns that align with macroeconomic expansions and contractions rather than isolated platform-specific factors.
Core Indicators and Their Measured Effects
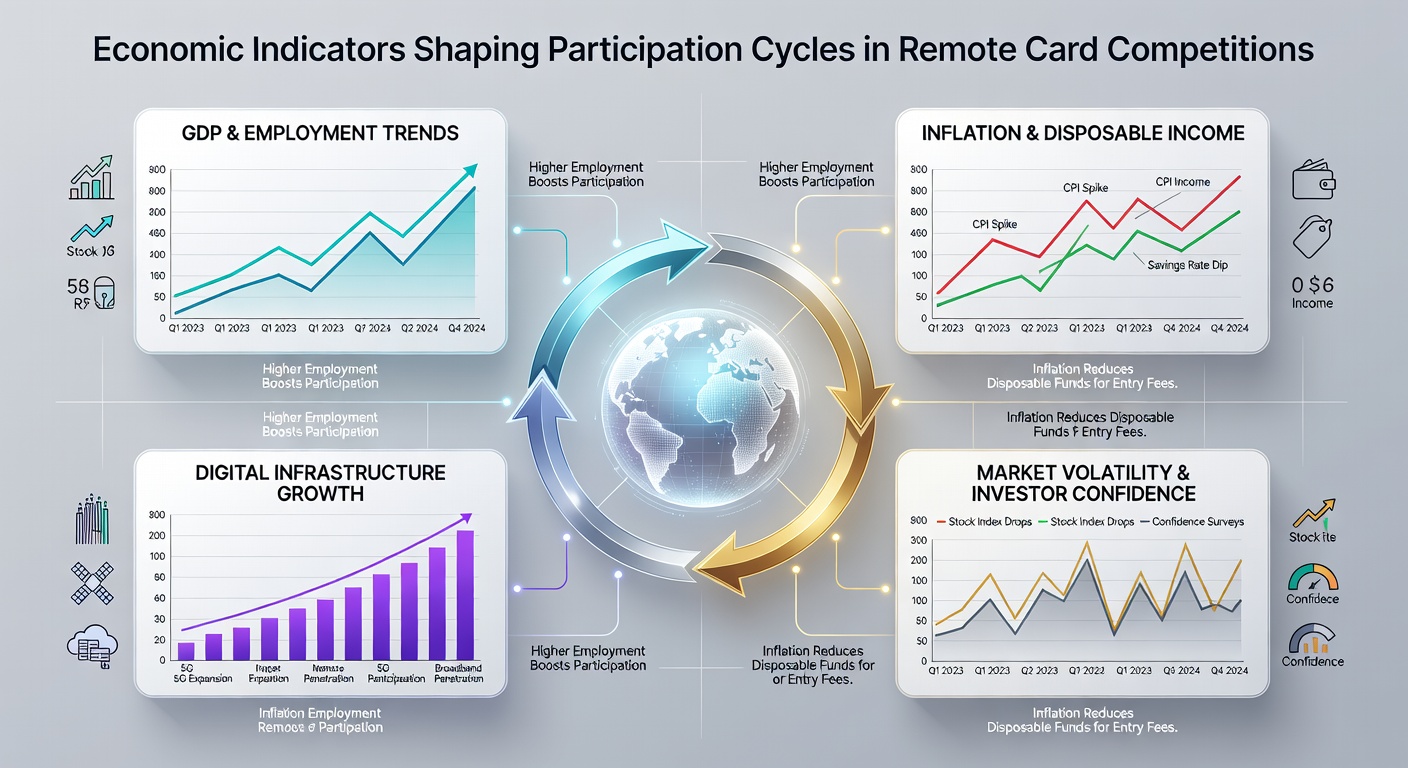
Unemployment statistics released by government agencies serve as one of the clearest signals for participation swings in remote formats. When joblessness rises, some segments reduce discretionary spending on entry fees while others increase activity in search of supplemental income streams, and researchers have documented both responses in longitudinal studies of player databases. Inflation metrics published by central banks further influence these trends because rising costs for everyday goods compress available funds for entertainment categories including virtual card events. Stock market performance tracked through major indices also correlates with deposit and withdrawal volumes on major sites, particularly during periods of sustained gains that boost household wealth.
Those who have analyzed aggregated transaction records find that gross domestic product growth rates in developed economies tend to precede upticks in average session lengths and multi-table participation. Conversely, contractionary periods often produce shorter engagement windows and greater concentration around lower-stakes events. European Central Bank quarterly releases and similar data from the Reserve Bank of Australia have been cross-referenced with platform metrics to illustrate these relationships across regions.
Regional Patterns Observed in 2026
In May 2026, several jurisdictions reported divergent participation trajectories that mirrored local economic releases. North American operators recorded steady growth in recreational player counts following positive employment revisions from Statistics Canada and the U.S. Bureau of Labor Statistics, while certain Asian markets showed more modest increases tied to manufacturing output figures. These variations highlight how currency fluctuations and trade balance data can amplify or dampen cross-border participation flows in remote card formats.
Academic papers examining player cohorts in Australia and Canada have identified similar lagged responses where changes in consumer confidence indices precede measurable shifts in tournament registration numbers. One study tracked over 200,000 accounts and found that a 1 percent rise in the consumer price index often corresponded wth a measurable decline in high-stakes volume within two months, whereas lower-stakes segments remained relatively stable or even expanded slightly.
Platform Adjustments and Data Correlations
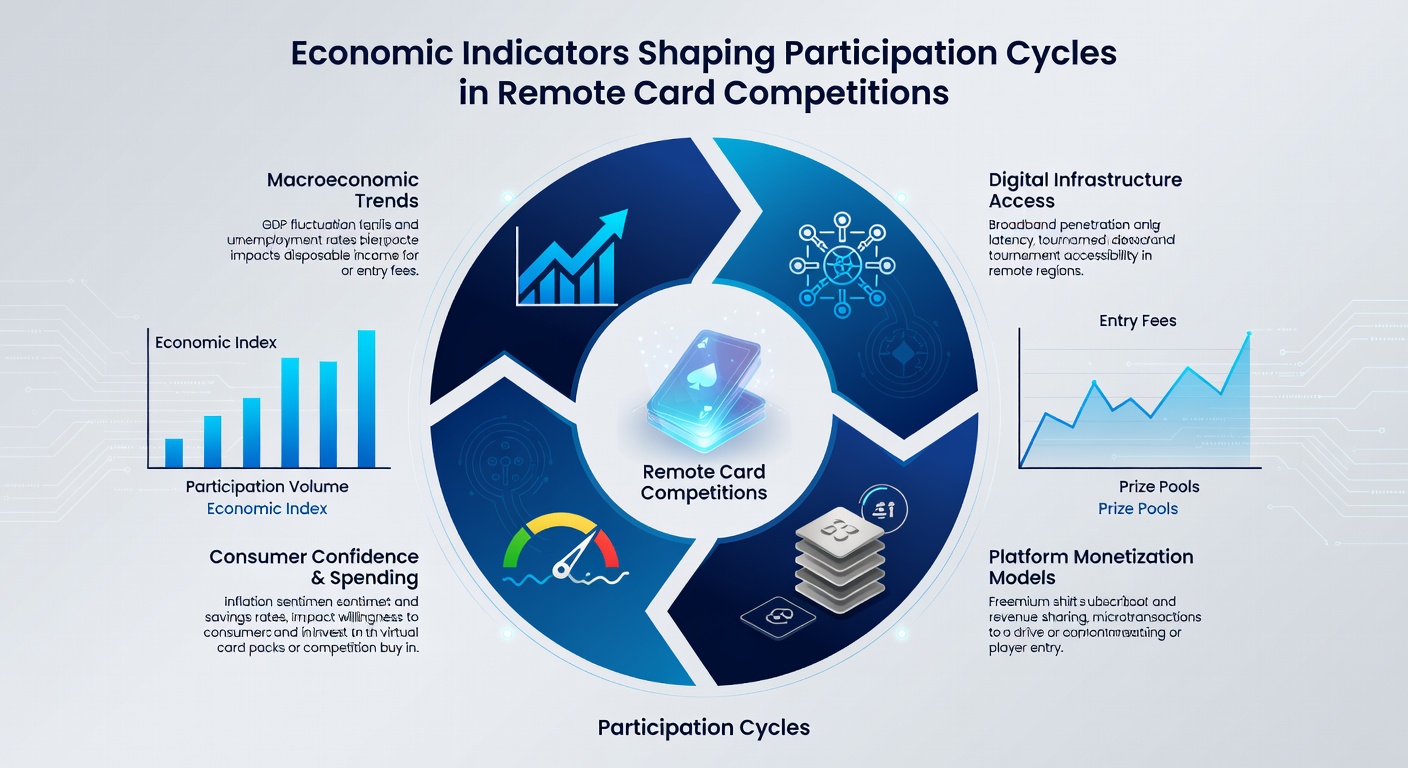
Operators have responded to these economic linkages by adjusting promotional structures and stake offerings during different phases of the cycle. When leading indicators point toward contraction, many sites increase the frequency of low-entry or freeroll events to maintain volume, and transaction logs confirm higher uptake of these formats during such windows. Conversely, expansionary signals prompt expanded high-stakes schedules and satellite pathways that feed into flagship tournaments.
Research conducted through partnerships between universities and gaming associations demonstrates that these adjustments align closely with publicly available economic calendars rather than purely internal performance targets. Figures released by the OECD on household disposable income across member countries have been used in several models to forecast registration trends months ahead, allowing platforms to calibrate marketing spend accordingly.
Longer-Term Cycle Dynamics
Participation cycles in remote card competitions display multi-year patterns that often mirror broader business cycles rather than short-term fluctuations alone. Data spanning 2018 through 2026 indicates that recovery phases following recessions typically produce the strongest growth in new account creation, while mature expansion periods see stabilization around higher baseline volumes. Currency exchange volatility tracked by the Bank for International Settlements further modulates these cycles for players who compete across borders, since fee conversions can alter effective costs in real time.
Analysts examining anonymized datasets note that demographic subgroups respond differently, with younger cohorts showing greater sensitivity to wage growth figures and older cohorts tracking retirement account performance more closely. These segmented responses create layered participation curves that operators monitor through internal dashboards calibrated against external macroeconomic releases.
Conclusion
Economic indicators continue to provide measurable context for understanding participation cycles in remote card competitions. Government statistical agencies and international organizations release data that researchers and platforms routinely integrate into forecasting models, revealing consistent relationships between employment, inflation, income, and engagement levels. As these datasets grow more granular, the precision of cycle predictions improves while the underlying connections between macroeconomic conditions and digital card activity remain evident across regions.