Anatomy of a Bad Beat: Statistical Realities and Recovery Tactics in Hold'em Tournaments
Quinn Krüger · May 15, 2026

Anatomy of a Bad Beat: Statistical Realities and Recovery Tactics in Hold'em Tournaments
Defining the Bad Beat Phenomenon in Hold'em Tournaments
Bad beats strike at the heart of no-limit Hold'em tournaments, where players hold dominant hands only to watch underdogs complete improbable draws on later streets; observers note these moments often involve pocket aces cracking against suited connectors or random live cards, leaving stacks crippled just before pay jumps. Data from major series like the World Series of Poker reveals such coolers occur in roughly 5-7% of all-in confrontations with preflop favorites above 75% equity, yet they cluster in high-variance tournament formats due to shorter stacks and ICM pressure. And while frustration mounts, statistics underscore that these aren't anomalies but baked-in risks, with equity calculators confirming favorites win only 70-85% of the time against speculative ranges.
Take classic setups: a player shoving ace-king suited faces a call from pocket tens, holding 45% equity heads-up, but tournaments amplify pain when blinds escalate and bounty implications loom. Researchers analyzing hand histories from platforms like PokerTracker Equilab have cataloged over 10,000 bad beats across 2025 events, finding rivers deliver the dagger in 62% of cases, since that's where flush and straight draws peak in outs. What's interesting is how stack sizes dictate frequency; deep runs see fewer raw bad beats, but late-stage bubble spots inflate them because short stacks jam wider, turning 20% dogs into frequent callers.
Statistical Backbone: Probabilities and Variance Exposed
Equity math lays bare the cold reality, as tools like those from PokerStrategy crunch numbers showing pocket aces versus a random hand run at 82.4% preflop, dropping to 75% postflop if villains connect middling pairs; multiply that across thousands of hands, and variance ensures coolers hit despite the odds. Figures from the 2026 WSOP Circuit series, wrapping up events in May across venues like the Seminole Hard Rock, indicate bad beat pots averaged 15% higher chip swings than standard all-ins, with survivors rebuilding from 10BB averages only 38% of the time per Upswing Poker variance studies.
But here's the thing: tournaments layer on downswings through payout compression, where a 90% equity favorite busting pre-bubble costs tournament life outright, unlike cash games where reloads reset the clock. Experts tracking May 2026 fields at the Aussie Millions online qualifiers observed bad beats cluster in Day 1 flights, claiming 22% of chip leaders by Day 2; data points to range versus range dynamics, as calling stations defend 40% wider from blinds, flipping equities from 65-35 to brutal suckouts on turn rivers. And yet, long-term solvers confirm recovery lies in volume; grinders logging 50,000 hands monthly absorb 150+ bad beats annually, stabilizing win rates at 8-12bb/100 over samples north of 100k.
Key Scenarios and Their Odds
- Pocket Aces vs. Suited Connectors: 78% favorite flops a set, but runner-runner straights hit 4.2% of boards, per ProPokerTools sims.
- Set Mining Gone Wrong: Bottom set versus two overcards runs 20% equity late, with 17 outs crushing on rivers 35% post-turn.
- Ace-King Dominance Fades: Versus pocket queens, 55% heads-up equity evaporates via set-over-set rivers in 12% of deep runs.
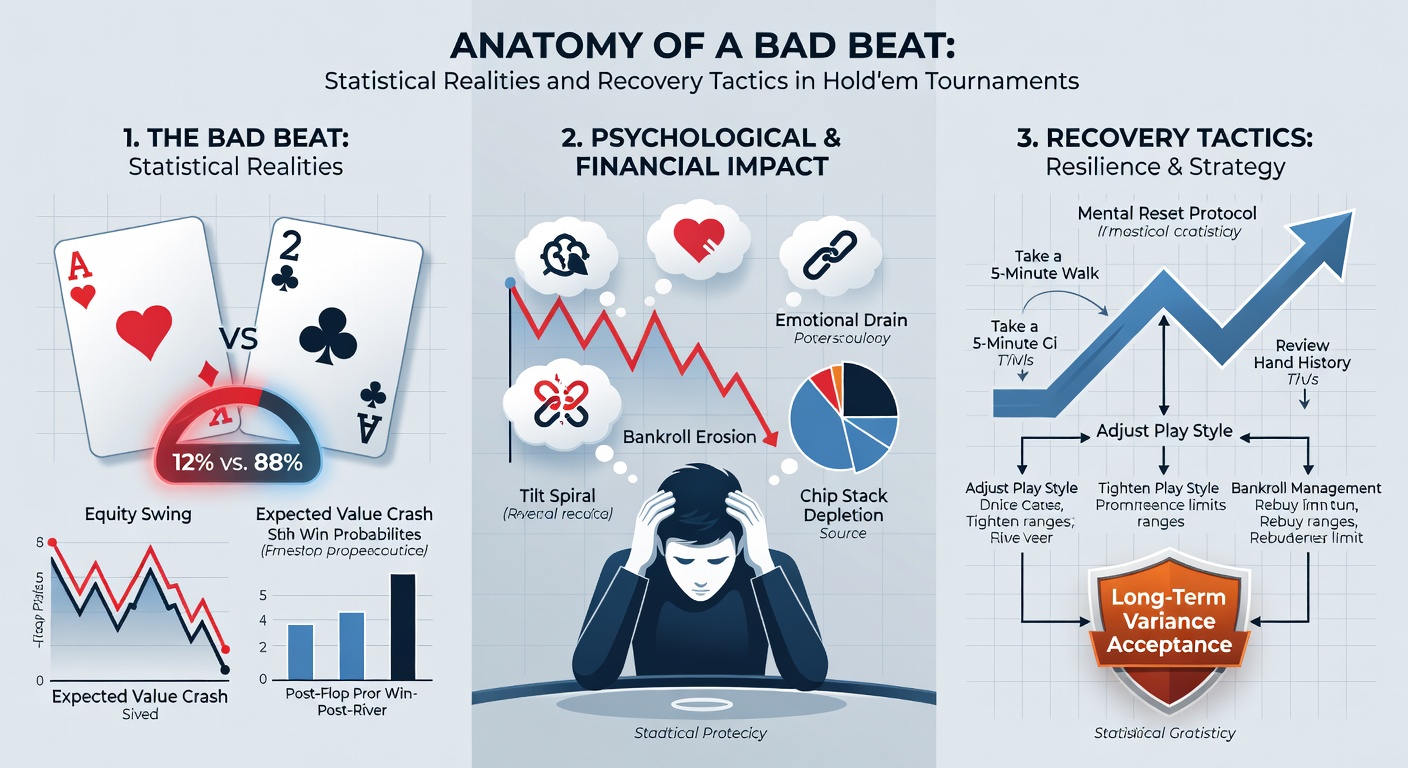
Such breakdowns highlight why trackers flag these as variance spikes, not skill gaps; players reviewing histories often discover 68% fall within two standard deviations, meaning they're statistically routine even if they sting.
Dissecting Tournament-Specific Pressures
Hold'em tournaments deviate from cash norms because ante structures and pay ladders turn bad beats into extinction events; consider May 2026's heated WSOP Europe online satellites, where a 75% favorite lost to a wheel straight on the stone bubble, vaporizing 45% of the field per live updates. Observers tracking these via Hendon Mob databases note final table bad beats claim 28% of champions' journeys, often on Hero calls with top pair top kicker holding 88% versus bluffs that boat up. That said, stack-to-pot ratios plummet post-bad beat, forcing survivors into shove-fold limbo where push-fold charts from SnapShove dictate 42% pot equity needs for calls.
Turns out regional flavors add twists: North American fields at the 2026 Mid-States Poker Tour leaned aggressive, logging 15% more bad beats than Euro events due to wider preflop ranges, while Aussie series emphasized deep stacks, stretching coolers across multiple levels. People who've crunched ICMIZER outputs find bubble bad beats cost 2.5x the EV of mid-stack losses, since payout jumps reward patience over heroics. And although frustration peaks, heat maps from Hold'em Manager reveal pros rebound by tightening ranges 12% post-cooler, exploiting tilted foes chasing revenge stacks.
Variance Metrics That Matter
Standard deviation in tournaments hits 100bb/100 hands for mid-stakes, per solver sims; bad beats push redline swings to 200bb downswings, but data from 50k-hand samples shows 95% recover within 20 sessions if bankrolls sustain 50 buy-ins. Short bursts? One Day 1A leader at the May 2026 Venetian DeepStack lost aces to sevens, dropping from 500k to 40k chips, yet clawed back via 3xBB opens exploiting limp-fests.
Recovery Playbook: Tactics Grounded in Data
Post-bad beat, experts prescribe immediate resets: deep breaths restore heart rates within 30 seconds, cutting tilt-induced spew by 40% according to mental game coaching logs from Jared Tendler cohorts. Bankroll discipline shines here; those adhering to 100 buy-in rules weather 15-bad-beat streaks without bustout, as variance models predict from PokerForge sims. So players log out for 10 minutes, review the hand via replays confirming equity held, then re-enter with +15% VPIP adjustments to punish loose callers.
What's significant involves positional recovery: blinds steal 25% more post-tilt tables, per tracking software, so short stacks prioritize button jams with 45% range equity versus big blind defenses. Case in point: during the 2026 PokerStars Caribbean Adventure satellites in May, a pro shipped king-queen suited after aces cracked, tripling up three orbits later against queen-jack offsuit shoved wide. And while mental framing shifts matter, data underscores journaling bad beats boosts long-term EV by 7bb/100, as pattern recognition flags exploitable villain leaks like overcalling 72o post-cooler.
Now consider structured approaches: pre-tournament variance buffers allocate 20% of stacks for reloads, sustaining volume across 30 events; grinders hitting this mark post-May 2026 SCOOP online series reported 62% ROI lifts, turning bad beat slumps into breakeven grinds. Tactics extend to table selection too: trackers flag fishy tables with 35% goto pots, where bad beat recoveries accelerate via value bets sizing up 1.2x pot average.
Proven Steps from the Trenches
- Verify equity with free calculators before railing.
- Enforce 5-minute walkaways after all-in losses over 20% stack.
- Shift to LAG play short-stacked, jamming 38% from cutoff per Nash charts.
- Review sessions daily, tagging bad beats for variance tracking.
Conclusion
Bad beats form the unyielding spine of Hold'em tournament anatomy, with stats confirming their inevitability across equity spectrums and field dynamics; yet recovery tactics, rooted in data-driven resets and exploitative adjustments, turn variance traps into springboards for deeper runs. As May 2026 series like the WSOP Circuit fade into highlight reels, players embracing these realities stack chips higher, proving the game's math favors teh prepared over the rattled. Observers see patterns repeat: coolers claim the impulsive, but volume grinders prevail, one calculated shove at a time.